Showing posts with label SPO600. Show all posts

Saturday, December 14, 2019

SPO600 Project Post 5

After reviewing other's people work on their projects. I've realized I forgot to test on the other systems Bbetty and Xerxes. I first attempted to install Redis onto Xerxes, our x86_64 system... No go, apparently everyone loves testing on the machine so much there's no more storage space left to install my project.

So that left Bbetty, wow. This machine is much faster than Aarchie, its sibling Aarch64. The same benchmarks I was running on Aarchie were completed in half the time:


Average run time was about: 25.67 seconds

As my optimizations didn't work on Aarchie, I was pretty sure they weren't going to work on Bbetty either, but for the sake of curiosity I decided to test them and here are the results:


Average run time was about: 25.64 seconds, 0.02 faster, but again like Aarchie, this was a small sample out of many I did and they weren't always reliably faster.

I doubled the amount of SET operations to 2 million to see if there were any efficiencies gained, because perhaps there might be some if there was more requests processed? I got average run times of about 51.435 seconds. A big giveaway whether optimizations gained from my code changes would be to check the throughput of the requests per second completed. They remained relatively the same if not a bit lower sometimes than the non modified code. So I'm pretty sure I can conclude my changes have failed to produce any optimizations. 

For anyone extremely curious about the call graph for the benchmark of the 1 million SET operations (I apologize for the poor picture quality):

Wednesday, December 11, 2019

SPO600 Course Wrap Up

We're at the end of the course! This felt like a really long course, but very interesting and fun. Throughout all of my years at Seneca I never really got to interact close to the hardware level, and this course finally allowed me to. I can finally say I've programmed in assembly language!

Overall, I found this course extremely difficult, I'd listen to the lecture in class, look at the lab briefly and kind of just close the window. The labs themselves were pretty challenging and required us to look up a lot of stuff as well as reading other people's blogs if we were stuck to get an idea of how to proceed. Which isn't that much different from the real world when we do get stuck. I recall setting aside a whole weekend just to do the weekly labs.

As a student who only learned the basics of C for a semester as an introductory course, trying to understand the C code being used or talked about in class was also challenging. That coupled with the fact that our project selections were recommended to be in the C language also made it extremely hard, as I'm assuming most of the libraries are written by people who are very fluent in C. Trying to read the code is kind of like deciphering a language we barely know.

All this isn't to say I didn't enjoy the course, it was quite the opposite. I don't think I've found another course aside from this(SPO600) or OSD600 where I decided to spend so much time on it. Our professor, Chris Tyler was amazing, with lots of professional experience and also keeps himself up to date with the industry. During the project phase of the course he'd show us possible optimizations for libraries every week as he knew quite a bit of us were frustrated on trying to find one. He also tried help remove any roadblocks we encountered by tackling them in class.

I'm a little disappointed and sad I wasn't able to find an optimization for my project Redis, as I thought it would've been pretty cool to put it on the resume for potential employers and also the fact that we're using Redis as part of an internal project for the school. It was fun though doing instrumentation and profiling on Redis and analyzing the results to see if my changes improved the run time of SET operations.

Lastly, I'd like to thank Professor Tyler for teaching this course and also spending time on analyzing the results of the profiling and instrumentation of my project!

SPO600 Project Post 4

So this is the post where I'm testing my supposed optimizations. A quick recap, I made changes to Redis's version of the reallocate function. It will now only reallocate memory if the size of the new pointer is larger than the current size pointer, otherwise it will just 0 the block of memory.

These are the results of running the following command
-redis-benchmark -t set -n 1000000

which means we're running 1 million set commands with 50 parallel clients of 3 bytes payload.

These are the results without any optimizations


Average run time is about 79.3775 seconds

Here are the results after some preliminary modifications:


Average run time is about 81.8175 seconds. Wait... that isn't an optimization. It has become slower! After some slight checking of the "optimizations" I made, I realized I missed updating an area. Here are the new results after:


These are the more notable results. As I was testing it randomly throughout the day, I got some results that were 0.14s-0.2s faster to times that were sometimes up to 1.5s -2 s slower. As explained in class by Professor Tyler, I don't think the upstream will accept this code change, as it is not reliably faster AND also potential improvements are only roughly 2.5% gains.

Friday, December 6, 2019

SPO600 Project Post 3

Continuing from the second post, I found the file calling all the je_malloc related functions... in a file called zmalloc.c.

One of the key things we could look at was the following:
  • check if Redis was trying to allocate new memory for set operation
    • if it did, could we just overwrite the already allocated memory block for another set operation?
 I was able to find the reallocate function with the code below:
Upon going through the code you'd notice in the second #ifdef HAVE_MALLOC_SIZE scenario, 

  oldsize = zmalloc_size(ptr);
  newptr = realloc(ptr,size);
  if (!newptr) zmalloc_oom_handler(size);

  update_zmalloc_stat_free(oldsize);
  update_zmalloc_stat_alloc(zmalloc_size(newptr));
  return newptr;

The code doesn't check if the new size being defined is smaller or equal than the already allocated space. What we could potentially do is what Professor Tyler suggested last week, here we can zero the memory instead of reallocating for sizes that are smaller than the current size(oldsize).

Thankfully the C library has a function in the following signature 
void memset( void *str, int c, size_t n)
str - the pointer to the block of memory
c - the value to bet set
n - number of bytes set to the value

With that, we can change the code to look like:

    oldsize = zmalloc_size(ptr);
    if (oldsize >= size){
        memset(ptr, 0, oldsize);
        return ptr;
    }
    else{
        newptr = realloc(ptr,size);
        if (!newptr) zmalloc_oom_handler(size);
        update_zmalloc_stat_free(oldsize);
        update_zmalloc_stat_alloc(zmalloc_size(newptr));
    }
    return newptr;
On a side note, at the end of the lecture class, Professor Tyler informed us of an ARM instruction that zeros the data cache by address and X86_64 should have a somewhat equivalent I can implement as a possible optimization. Later when we met again, he explained to me the ARM instruction cannot be done as the Exception Level has to be at least 1 or higher in order not to trap.

In a search for the other optimizations we could do for Redis, he suggested running a strace with the process ID of the redis-server. So I would run Redis server using redis-server, add a strace to the process and then running the redis-benchmark to check for system calls. With the file obtained from the strace, I'd look for systems calls of brk or sbrk where the program is allocating more memory. Unfortunately, this didn't result in anything.

As soon as I can get gprof working on redis-server, I will try to find whatever is calling the je_malloc_usable_size ~8.5% of the time for the execution of the Redis server. As the professor has noted, the program spends close to 16.5% if its execution time calling je_malloc_usable_size, je_free and je_malloc.


Tuesday, November 19, 2019

SPO600 Project Post 2

After the initial testing. I realized I was doing the benchmarking wrong. I was doing a perf report on redis-cli (tool to interact with Redis server) instead of the actual server. A proper benchmarking displayed the following:


I did a quick grep -rn 'redis-stable/' -e 'je_malloc' to find what the code looked like for the library it was using:
je_malloc_usable_size(JEMALLOC_USABLE_SIZE_CONST void *ptr) {
        size_t ret;
        tsdn_t *tsdn;

        LOG("core.malloc_usable_size.entry", "ptr: %p", ptr);

        assert(malloc_initialized() || IS_INITIALIZER);

        tsdn = tsdn_fetch();
        check_entry_exit_locking(tsdn);

        if (unlikely(ptr == NULL)) {
                ret = 0;
        } else {
                if (config_debug || force_ivsalloc) {
                        ret = ivsalloc(tsdn, ptr);
                        assert(force_ivsalloc || ret != 0);
                } else {
                        ret = isalloc(tsdn, ptr);
                }
        }
        check_entry_exit_locking(tsdn);
        LOG("core.malloc_usable_size.exit", "result: %zu", ret);
        return ret;
}

Now I was pretty lost, I asked the professor just what kind of optimization I can look at. I was given a few suggestions
  • check if Redis was trying to allocate new memory for set operation
    • if it did, could we just overwrite the already allocated memory block for another set operation?
  • check if there are a lot of deallocated memory, if there is perhaps we can allocate different size memory blocks for set operations
The function I posted above was used a lot, digging a bit deeper into the code that used the je_malloc library. I discovered it was quite complicated. Redis allows for users to define threads for operations which vastly speeds up the operations it uses.

In a perfect world, when writing data the different threads will always access different blocks of memory. However, the world is not perfect and there is a chance threads will attempt to write to the same area in memory. To avoid this, the program uses something called arenas specifically for different threads to use, to avoid stepping on each other's toes. 

Memory fragmentation is also an issue, because Redis is used as a database, having data stored in memory contiguously will make get operations more efficient. jemalloc improves on malloc by trying to minimize memory fragmentation.


Thursday, November 14, 2019

Release 0.3

I recall at the beginning of the semester our professor told us sometimes during the course it is ok if we don't have a PR for an external bug as long as we're working on it. Trying to find out what's causing the bug actually takes the longest and the fix could be a change in a line or two of code. As I listened to this story, I thought "Yeah right, what are the chances of this happening to us?"

One of my goals for this course was to have a bug fix for a project from a big organization. I previously mentioned, I chose to work on a bug from Googly Blockly as it fit the bill, specifically this issue here.

Blockly is used by developers to create Blockly apps. These apps are usually for students or the public to teach coding in a beginner-friendly way. 

If the issue with the link didn't provide a good overview here's a quick rundown of the issue. The person filing the bug provided some XML code to load three blocks, one stacked block of two connected blocks and one orphaned block to the right of the stack. The stacked block are pieces that can connect anywhere, whereas the orphaned block is an end piece.

I should technically be able to:
  1. drag the orphaned block over to the first block in the stack
  2. the orphaned block should replace the second block on the stack
  3. the current second block on the stack should be detached from the stack as it cannot connect to the new second block as it is an end piece
This is not happening, instead I am able to only connect the orphaned block to the last block in the stack and instead create a 3 stack block.

I tested each separate block in the stack and can confirm each of them can be connected to the orphaned block individually and this issue is only happening when there is a stack.

A frequent contributor to the project @BeksOmega gave me some pointers on what to look for as the main culprits:
  • a function called showPreview_ displaying a translucent preview of the result if the user was to connect the block
  • a function called shouldReplace_ should be called when the user drops the block and blocks connect
  • OR none of these functions get called and I have to just trace the call stack and figure out what's wrong
Guess which route I got? I spent a week tracing the call stack and identifying what each function being called did and returned.

Following the whole call stack, I finally found the culprit, the following switch statement:

case Blockly.NEXT_STATEMENT: {  
      // Don't let a block with no next connection bump other blocks out of the  
      // stack.  But covering up a shadow block or stack of shadow blocks is  
      // fine.  Similarly, replacing a terminal statement with another terminal  
      // statement is allowed.  
      if (candidate.isConnected() &&  
          !this.sourceBlock_.nextConnection &&  
          !candidate.targetBlock().isShadow() &&  
          candidate.targetBlock().nextConnection) {  
        return false;  
      }
This switch statement was inside the function Blockly.Connection.prototype.isConnectionAllowedThe comment provided in the code perfectly explains why our orphaned end block was unable to replace the last block on the stack.

I tested a quick and dirty fix of modifying the return false statement to return true to see if it resolved the issue:
It worked! However, the quick and dirty fix may cause other issues as there was a case specifically written for this scenario, so this change will probably negatively affect other scenarios. I discussed this with @BeksOmega and asked for her opinion raising my concern and pointing out maybe the behavior which she observed that applied to rows was instead the bug.

A person from Google eventually joined the discussion and we are waiting to hear back from another member until we decide on a way to fix this issue.

For my second internal issue, I decided to write unit tests for the feedparser function I submitted. At the time of my feedparser PR, the project didn't have any testing packages installed yet. It was fun and different as I have never written tests before, it required us to think of tests for not only normal scenarios, but for edge cases as well. 

Sunday, November 10, 2019

SPO600 SIMD Lab4 Pt2

Part2
What is SIMD?

Stands for Single Instruction Multiple Data, it allows parallel processing of the same operation for data. There are different sizes of registers for SIMD from 128 bits to 2048 bits and we're able to split these bits into different lanes.

We'll use a 128 bit register as an example, these are the different types of lane configurations available:

  • (2) 64 bit lanes
  • (4) 32 bit lanes
  • (8) 16 bit lanes
  • (16) 8 bit lanes

Take this for loop as an example:

int ttl = 0;
  for (int x = 0; x < 100; x++){
   ttl += 5;
}

We could technically speed this up by having the compiler auto-vectorize the loop because the operation is not dependent on the value of ttl as we're just adding 5 to it regardless. So we can technically run this loop in parallel with SIMD. Due to the max value of 8 bits being 255 and the value of ttl will most likely be bigger than that, the max number of lanes we should be splitting a register into is 8 so we can accommodate values up to 65536.

Even though we do split the lanes, sometimes the compiler does not auto-vectorize code:

  1. the overhead cost of vectorization outweighs the benefit of vectorization
  2. loops must not overlap in a way that is affected by vectorization

The first point is pretty self explanatory.
The second point - if the operation being carried out in the loop was dependent on the value of its previous iteration, the loop will fail to auto-vectorize.

As part of the SIMD lab we had to change code so another loop could be auto-vectorized. We were provided the following code for the third for loop of the SIMD lab

        for (x = 0; x < SAMPLES; x+=2) {
          ttl = (ttl + data[x])%1000;
        }

In an attempt to auto-vectorize the loop for the SIMD lab, I made the following code change:

        for (x = 0; x < SAMPLES; x+=2) {
          ttl += data[x]%1000;
        }

The loop vectorized, the math is a little off and I wasn't able to get the same answer as the implementation of the non-vectorized one.

SPO600 Project Selection

In an attempt to learn more about the backend we're using as part of our OSD600 internal project and to make contributions to a widely used open source project, I decided to optimize Redis as my SPO600 project.

First I had to create some data:

for ((x=0; x<100; x++)) ; do echo "$(dd if=/dev/urandom | tr -d -c "a-z" | dd bs=15 count=1 2>/dev/null)=$(dd if=/dev/urandom | tr -d -c "a-z" | dd bs=10 count=1 2>/dev/null)" | cat >> testData ; done

this block of of code will run a for loop 100 times
within the loop:
  • output to the screen randomly generated key(15 chars) value(10 chars) pairs made up of lower case letters
  • .take whatever is outputted on the screen and append to a file called testData
At the moment I can run a perf record with the following bash line

perf record redis-cli set foo bar
  • this allows me to do a sampling of the command set foo far
which generates the following report:


Upon further research, Redis actually comes with its own benchmarking tool called redis-benchmark. A great source of documentation published on DigitalOcean can be found here.

An example of a command I ran:

redis-benchmark -t set -n 10000

A simple breakdown of the command
  • redis-benchmark - the command
  • -t (command)- use a subset of tests specified by command, in this case I'm using set
  • -n (number of requests)- number of commands to carry out 

The tool is useful because it allows me to track how many seconds it took to complete each operation for x amount of requests, which in this case it to set 10000 key value pairs. 

The command also allows users to specify how big each randomly generated block size (for the key/value pairs) should be(default 3), to ensure consistency between operations. I also am not only limited to just benchmarking the set only, I can specify in the CLI set,get and redis-benchmark will then also benchmark how long it took to get x amount of values.


Wednesday, November 6, 2019

SPO600 SIMD Lab4 Pt3


Part3
Part 2 was to use inline assembler code, this allows assembly code to be used in C. The lines of assembly code are easily identified by __asm__.

int main() {
        int a = 3;
        int b = 19;
        int c;

        // __asm__ ("assembley code template" : outputs : inputs : clobbers)
        __asm__ ("udiv %0, %1, %2" : "=r"(c) : "r"(b),"r"(a) );
        __asm__ ("msub %0, %1, %2, %3" : "=r"(c) : "r"(c), "r"(a),"r"(b) );
        printf("%d\n", c);

As shown in previous labs, assembly code is architecture specific. Different architectures have different instructions to carry out the same type of operations. The example above is aarch64 specific (x86_64 has a single instruction that calculates the quotient and puts the remainder in a specific register).

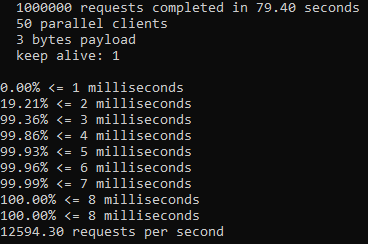
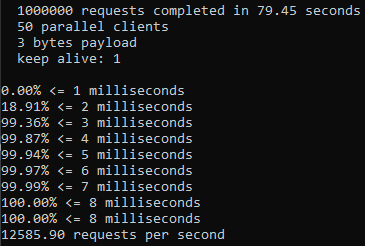
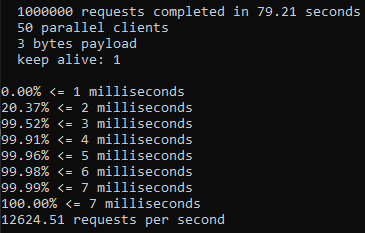
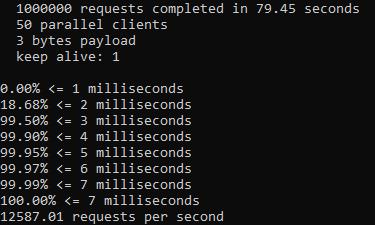
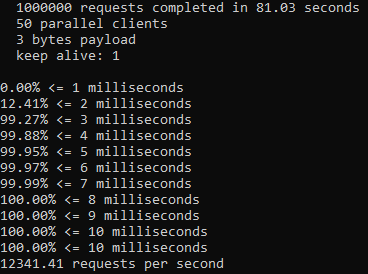
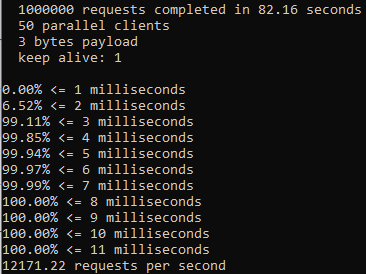
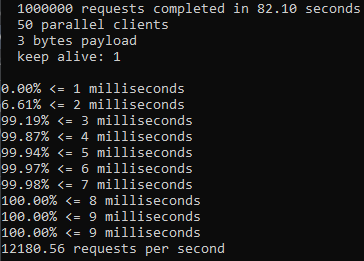
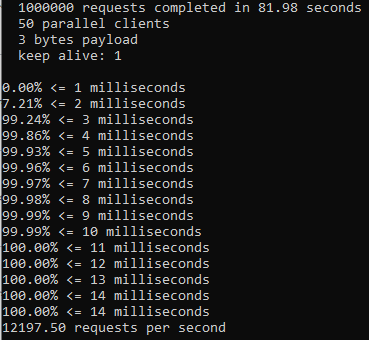
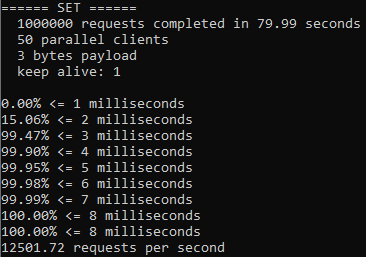
Testing with 10 million sample data


Q1.
// these variables will be used in our assembler code, so we're going
// to hand-allocate which register they are placed in
// Q: what is an alternate approach?
  register int16_t*       cursor          asm("r20");     // input cursor
  register int16_t        vol_int         asm("r22");     // volume as int16_t

We could do it just like the assembly code from the sample assembly code
int16_t* cursor;
int16_t vol_int;

and just use the variables with "r"(cursor) or "r"(vol_int) when we are using inline assembly instructions

Q2.
// Q: should we use 32767 or 32768 in next line? why?
  vol_int = (int16_t) (0.75 * 32767.0);

I think either works, normally we'd use 32767 as that is the largest 16 bit integer. However since we are multiplying it by 0.75, using 32768 is fine.

Q3.
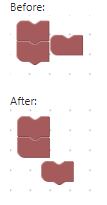
// Q: what does it mean to "duplicate" values in the next line?
  __asm__ ("dup v1.8h,%w0"::"r"(vol_int)); // duplicate vol_int into v1.8h

The syntax for dup is DUP Vd.T, Vn.Ts[index]
The most important part here is the Vd.t where Vd  is the name of the register from 0-31. T is the number of lanes we are the number of lanes we are splitting the register into 8 lanes.
Therefore we are splitting register 1 into 8 different lanes of 16 bits each and duplicating the value of vol_int into each of them.

Q4
__asm__ (
                        "ldr q0, [%[cursor]], #0        \n\t"
                        // load eight samples into q0 (v0.8h)
                        // from in_cursor

                        "sqdmulh v0.8h, v0.8h, v1.8h    \n\t"
                        // multiply each lane in v0 by v1*2
                        // saturate results
                        // store upper 16 bits of results into
                        // the corresponding lane in v0

                        // Q: Why is #16 included in the str line
                        // but not in the ldr line?
                        "str q0, [%[cursor]],#16                \n\t"

We don't offset with the ldr because we want the whatever is in the first 16 bits of cursor to be loaded into q0. We then store whatever is in q0 into cursor before we move onto the next 16 bits in cursor's register. If we used 16 for the first line, by the end of the program we would have stored values into memory that may be for another variable.

Credits to this site for helping me understand this whole question.

Q5
                        // store eight samples to [cursor]
                        // post-increment cursor by 16 bytes
                        // and store back into the pointer register

                        // Q: What do these next three lines do?
                        : [cursor]"+r"(cursor)
                        : "r"(cursor)
                        : "memory"
                        );

The first line is the input, second line is the output and third line is the clobber, memory denotes the inline assembly code reads or writes to items other than those listed in the input and output.

Intrinsics
while ( cursor < limit ) {
                // Q: What do these intrinsic functions do?
                vst1q_s16(cursor, vqdmulhq_s16(vld1q_s16(cursor), vdupq_n_s16(vol_int)));

Using this link as a guide.

Like the previous inline assembly, we're duplicating the value of vol_int into each of the 8 lanes, then multiplying each of them by the value of cursor and returns the high half of the truncated results. Lastly we will then store those truncated results into cursor

                // Q: Why is the increment below 8 instead of 16 or some other value?
                // Q: Why is this line not needed in the inline assembler version
                // of this program?
                cursor += 8;
        }

We're only storing the high half of the truncated results which means it is only 8 bits, hence we only need to offset by 8 bits.

Tuesday, November 5, 2019

SPO600 Lab4 (Algorithm Selection) Continued

Building on top of the previous post, the second task of the lab was to create a look-up table with all the samples already scaled.

Refer to the code below to see some changes to the original code:

 // since we can't use negative index we start at the lowest value
        int16_t val = -32768;

        // create and populate array with scaled sample values
        for (int i = 0; i < size; i++){
                lookupTable[i] = scale_sample(val, 0.75);
                val++;
        }

        // Allocate memory for large in and out arrays
        int16_t*        data;
        data = (int16_t*) calloc(SAMPLES, sizeof(int16_t));

        int             x;
        int             ttl = 0;

        // Seed the pseudo-random number generator
        srand(1);

        // Fill the array with random data
        for (x = 0; x < SAMPLES; x++) {
                data[x] = (rand()%65536)-32768;
        }

        // ######################################
        // This is the interesting part!
        // Scale the volume of all of the samples
        for (x = 0; x < SAMPLES; x++) {
                //need to add 32768 so we don't get a negative index
                data[x] = lookupTable[(data[x]+32768)];
        }

Overall, it was weird. I expected it to be faster, I even gave it an edge by doubling the number of samples to 10 million instead of the original 5 million.


A perf report of vol2 shows 0.05% of the time was spent scaling the sample.


The original for reference with 10 million samples


A perf report of vol1 is also shown below


Sunday, November 3, 2019

SPO600 Compiler Optimizations

As we start our projects for SPO600, the professor introduced the class to optimizations the compiler does automatically for code, so we don't try to do similar ones manually. I'll explain a few ones as it was interesting (at least to me) what types of things are done behind the scenes make code more efficient.

Hoisting
Some times code written in a loop is the same no matter the iteration. For example

//Increments i by k
int k;
for (int i = 0; i < 10; i++){
  k = 5 + 9;
  i += k;
}

Since the value of k is 14 no matter how many times the loop is run. The compiler figures it can move the line k = 5+9; outside of the loop so we get something like the the below

//Increments i by k
int k;
k = 5 + 9;
for (int i = 0; i < 10; i++){
  i += k;
}

This shaves off a bit of computing time because now k doesn't have to compute the value of k for
i < 10 times.

Dead Store
This sometimes happens in code, a variable assigned a value, is assigned another one before it is used. For example

//Increments i by k
int k;
k = 0;
k = 5 + 9;
for (int i = 0; i < 10; i++){
  i += k;
}

As you noticed, k = 0; is never used and is reassigned to 5 + 9; The compiler notices this when it does an internal representation of the code and will remove k = 0 so the code becomes

//Increments i by k
int k;
k = 5 + 9;
for (int i = 0; i < 10; i++){
  i += k;
}

Strength Reduction
Multiplication and division in code is more expensive than adding or subtracting. Take the following for example

//Multiplies i by k
int k = 5;
for (int i = 0; i < 10; i++){
  int c = k * i;
  printf(c);
}

The compiler will do something like the below:

//Multiplies i by k
int k = 5;
for (int i = 0; i < 50; i+=5){
  int c = k + i;
  printf(c);
}

Both programs will output 0, 5, 10... up until 50. However the multiplication operation has now been swapped out for an addition operation.

Wednesday, October 2, 2019

SPO600 Lab4


Lab4. For this lab we're testing out a few things we talked about in regards to optimizing, as this is still a work in progress I'll flesh out the rest of the post later.

This is our starting file, pretty basic, we'll have 5 million random sound samples created by RNG. Scale the volume of all the samples by 0.75 then sum up the data. A few run of the command

time ./(file_name_here)

provided the following outputs. The following provides a breakdown of what each section is

real - total elapsed time
user - amount of cpu time spent in user mode
sys - amount of cpu time spent in the OS/system

One factor to account for the variance. This is run on a system shared by 30-40 other classmates. If there's a few of us attempting to generate 5 million samples and scaling them, a few times, that could cause it to take longer than usual.


SPO600 Ramblings

Coincidentally when I first got together with my group during our first lab, we were all pretty confused. This class was called Software Optimization and Portability, I was with a few group members who didn't read the course outline and thought this course was on refactoring or just writing code in general, be it more efficient, cleaner... You get the point.

I actually read the course outline, yet I didn't know what to expect, was this going to be like my Open Source Development Class? Were we going to be taught a few basics and thrown to the wolves? Were we supposed to find a smallish open source application and port that to another platform than intended?

Furthermore we were even more confused when we were told to start programming in assembly for X86_64 and ARM64 architecture during our lab. At this point a few people in the group were already rethinking about their choice in enrolling for this course. I guess what was going in our minds was
HOW IS THIS HELPING US LEARN SOFTWARE OPTIMIZATION? and "WE DON'T EVEN KNOW WHAT WE'RE DOING IN THIS LAB, god help us".

It wasn't until recently during our lecture where it kind of came full circle. The professor gave us an example using a digital image. Say we have a picture on a resolution of 1920 x 1080 and each pixel contains 3 bytes (RGB) in the non optimized scenario we'll have about 6 million bytes to render. However if we analyze the picture, we could make a table of all the colors existing in the image reducing the need to hold data for shades of colors that are not used. 

Furthermore to reduce the size of the table, if we take pixels on the screen which are extremely close in shade, we can settle with either of the colors for both to further reduce the amount of colors needed for the picture, further reducing data in what is called psychovisual redundancy. I am assuming this is what happens when you choose to compress an image and depending on the compression the computer may be more/less aggressive with this technique.

Similar techniques are also applied to sounds such as song files, as we can discard or de-emphasize the data that is less important or where humans will not be able to tell the difference. By reducing the number of bits used to describe a sample of music, it is very much similar to reducing the number of colors for a digital image on a screen. Just like when compressing images, the bit rate compression determines how aggressive the computer may be with this technique.

How does efficiency relate to anything our professor then asked? One application he mentioned was battery life of mobile devices. These steps into optimizing performance and efficiency is what allows us to use our mobile devices longer. As processing any data takes power, less processing means less power used.

Ah.

SPO600 Lab3 Pt2/2

Maybe its because I was too used to programming assembler on X86_64 but trying to do the same thing on ARM was a lot more difficult in my opinion. This week we finished up with the lab we were assigned by doing the same thing except on the ARM64 instead of X86.

The concept of a lot of the things are the same, such as use certain registers so your values don't get trampled or lost. 


I lied, with a bit of further practice, it is as the prof said: "easier than x86_64".

Just like with X86, we increased the string by one more character to accommodate the extra number, we also changed the register holding the max loop value to 30 and introduced another register to hold the value of the divisor.

There is also a loop written in if/else format with the more: and print: section. If the current loop count is greater than 10, the program will branch to label more: and continue from there, otherwise it will continue along and then branch to label print: section. I made sure some instructions were written after the branch to other labels as there's no point in calculating the ASCII value of register 25 or replacing the character of the string offset 7 if we're not going to use it or the character is going to be overwritten by a later instruction.

The biggest difference between the two architectures regarding this assignment was a division function that also calculated the remainder. In X86 there was a div instruction that put quotient and remainder into dedicated registers, ARM64 didn't have one and instead we had to use two instructions udiv to calculate quotient and msub to calculate the remainder.

In the following in the more: section the remainder was calculated by multiplying whatever the calculated quotient was from the previous line in register 23

udiv    x23,x20,x22

by 10 and then subtracting that from our current loop count.


SPO600 Lab3 Pt1/2

We started working on assembly as part of our lab, for the first part we worked with Xerxes (X86_64)

This was fun and much harder than the programming I've done for most of my life. In modern programming languages we would use variables to hold values or even refer to other variables. However in assembly, there are no variables in a sense. I can't just say int i = 1, if I want to use a loop I can't just keep increasing i and print it. 

I have to use the available registers and assign a value to them either from another register denoted by % or an actual value denoted by $. Another thing to take note of when writing in assembly is there are two 1 in a sense, 1 as a value... and 1 as a written number. In assembly, we found out the hard way if we tried to to output the current count of the loop in register 14, we wouldn't get a number. It is because we didn't change it to ASCII, if we printed our loop we'd see nothing really following Loop: , because the first 9 ASCII characters in the table are not even numbers. To get "string" output of the number we had to add a value of 48 to the current loop which you'll notice with the line 

add    $48, %r14

after that we replace the character c we put in the message as a placeholder with the number in register 14 to get the output. As a group we messed up earlier because we didn't change the line 

.section.rodata

and started getting compiler issues. It was because ro meant the line was read-only and we were trying to write to it. By changing the line to 

.section.data

the issue was solved. The syscall line will then output the msg line with the correct loop #, the register keeping track of the current loop count will then increase by 1 and we then compare if the loop count is equal to max(10). If not we jump back to the start of the loop: section and repeat.

When the current loop count is equal to max and comparison is done, a flag will not be triggered allowing the program to bypass the jne loop and move onto the movq $0, %rdi line


The next loop we wrote had to show a count of 00-30 while suppressing leading 0, meaning the program shouldn't write 01, 02 and so forth. A few immediate changes we made was to increase max to 30(duh) and add one more space preceding the c to account for the extra character. 

The difference here is that we use a divisor of 10 so we don't run into issues when replacing a character in the message with a number. Also the div operation always uses two registers, rax for quotient and rdx for the remainder. Another rule is rdx has to always be zeroed before the next division happens hence the 

mov $0, %rdx 

at the start of the loop: section. One other thing to note is the addition of two sections more: and less:. Which is really a if or else condition. Based on the the comparison between the current loop count and 10 one or both sections will be triggered. 


SPO600 Lab2

Assembled C Lab

This lab was done on x86_64 Architecture

The first image was compiled using the following command
gcc -g -O0 -fno-builtin

followed by
objdump -fs --source (program_name_here)

The following is an output of the main from the objdump command.


(1)
The following is an output adding the -static command when compiling, you will notice at 401bc3, instead of calling printf like the original, _IO_printf is called. The file is also a lot larger at 1720912 bits vs 22272 (standard). The reason being for this is because the executable must have all library files ready within its own executable file.


(2)
The following is an output by removing the -no-built-in command when compiling, so we're using built in function optimizations. At 40112f instead of printf being called, a puts function is called instead.

(3)
The following is an output by removing the -g command when compiling, skipping debugging information. You'll notice the line printf("Hello World!\n"); is missing now right after 401127, as this information is only useful for debugging... and we've told the compiler we don't need debugging info, it does not bother outputting any of that info, making the program smaller as well. Although the current size of the files are at 22272 vs 22272 bits each, we only have a few lines in our program (the printf line) so the savings by not using -g are non perceptible.

(4)
The following is an output by adding more arguments at the end of the printf. In my example I added an integer, float and another string. You'll notice there are much more lines in this <main> than any of the other images. This is because the we need more registers to hold the additional integer,, float and string values I added which is accomplished by the extra mov and movq.


(5)
The following is an output by moving the printf function in the main method to another function called output() and calling output() in the main method. You'll notice instead of calling printf, the program is instead calling output.


(6)
The following is an output by modifying the -O0 option when compiling which uses minimal optimization to -O3 ... make as many optimizations as possible, even ones that may be dangerous for certain programs. The program skips the first step entirely from the original and puts the printf line right onto the current location in stack. Instead of the mov of a value into the eax register, it does a xor of the register with itself


SPO600 Lab1

As part of this lab we were to find two projects with different licenses and do an analysis on their processes.

For this assignment I have chosen a project with an MIT license (React) and Apache License 2.0 (Kubernetes). In terms of differences between the licenses there isn't much actually although Apache is much much more verbose, both are pretty permissive except Apache requires users to maintain a modification notice of all changes they have made to the original software.

React
Filing issue
  1. Create issue on project's github - , describe if issue is a bug or feature request. If it is a bug, describe the current behavior and ways to replicate issue, describe expected behavior. Provide version of React user is using, browser that caused issue and OS. Provide any details on regression.
  2. A React JS core team member will take a look at issue and assign appropriate labels
Pull Requests
  1. Create pull request referencing issue, the bot for the repo will check for a signed CLA from the github user
  2. A bot called sizebot will do an analysis of different between code in master branch and PR 
  3. Code review for PR will be assigned to two other React JS core team members, only one approval is needed
  4. React team member merges commit


Kubernetes

Filing issue
  1. Create issue on project's github - https://github.com/kubernetes/kubernetes/issues, describe in detail regarding issue: environment, version, error logs and ways to reproduce issue
  2. Assign appropriate labels to issue
  3. Members will then check the issue and categorize by adding an area specific label and ping appropriate user to take a look at the issue
Pull Requests
  1. Create pull request referencing issue, the bot for the repo will automatically assign labels such as do not merge and assign code review to two members. Users are required to assign type of fix PR addresses and priority.
  2. If it passes code review, the PR is then assigned to the kubernetes patch release team
  3. Final approval from two senior contributors on the project and a maintainer
  4. Repo's bot will merge the commit while running tests
I personally like Kubernetes a lot more as it is a lot more automated with the K8bot they have in the repo handling merging and labeling.

Contains Duplicate (Leetcode)

I wrote a post  roughly 2/3 years ago regarding data structures and algorithms. I thought I'd follow up with some questions I'd come...